Gold and silver have faced stiff competition for investment dollars. There is little doubt that the cryptocurrency hype at the end of 2020 and the first quarter of 2021 sucked investment away from gold.
Some viewed it as a ‘no lose’ investment and others as the next generation alternative to fiat currencies. The sharp decline in cryptocurrencies over the last several months have diminished the pull of new investors into that market.
The continued rise in equity and housing markets still captivates investors’ interest. After all, the S&P 500 is close to doubling since its low set in March 2020 – currently sitting at 97% higher! And many stocks have returned much higher.
Tesla, for example, has surged 792% since March 2020, and that is even after the 30% decline from its peak earlier this year. Meanwhile, in US dollar terms the gold price is sitting at a not shabby in ‘normal circumstances’ 22% higher since its March 2020 low, this is about 13% below its all-time high set in August 2020.
What on Earth is Going on with Silver?
Watch Patrick Karim on GoldCore TV
Gold’s Correlation to Stock Market Indices
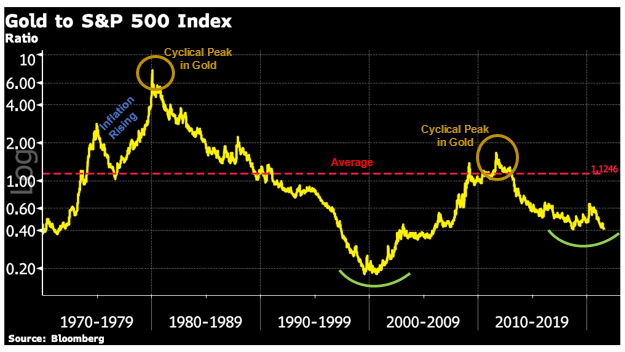
Looking back to 1970 the S&P 500 and Gold have an overall correlation of zero. This means that there is not a clear relationship between gold and the S&P 500; there isn’t a general rule saying if the S&P 500 increases then we would expect gold to increase or decrease.
This is not, true however if we look at shorter periods of time. One example of this is that generally at the beginning of recessions both gold and equities decline.
The chart below shows the relationship between Gold and the S&P 500 as a ratio (Gold/S&P 500). Looking at this ratio since 1970 we can see a cyclical pattern has emerged. The peaks in the prices signaled a peak in the ratio and the trough or bottom of this ratio in 1999-2000 signaled a cyclical peak in the S&P 500. The ratio of gold to the S&P 500 now sits well below the average and looks to be forming a bottom.
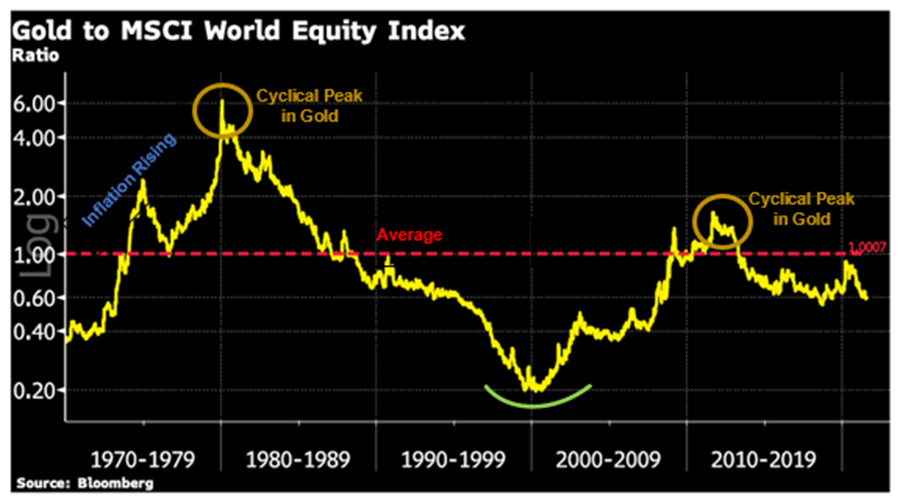
The relationship between the gold price and MSCI World Equity Index as a ratio shows a very similar pattern to that of the gold price and S&P 500.
However, the ratio of the gold price to the UK’s FTSE 100 index is not as clear at this time. (Note that that the data for this index only goes back to 1982.) The pattern is similar until around 2013. Different industry composition of FTSE kept it above the average, and it rose much more prominently during 2020’s gold price rise.
Also, FTSE had less runup since the March 2020 low versus the other two indices – the FTSE Index has increased 40% compared to the aforementioned 97% (the MCSI world index has increased 92% over this same time period).

There are more important things in the world than stock prices. In fact, stocks are just one of the dozens of things competing with gold as an effective store of value for investors [although none have 5000 years of history]. Let’s examine datasets of gold prices versus some less financialized items.
Gold’s Dynamics with Other Financial Markets
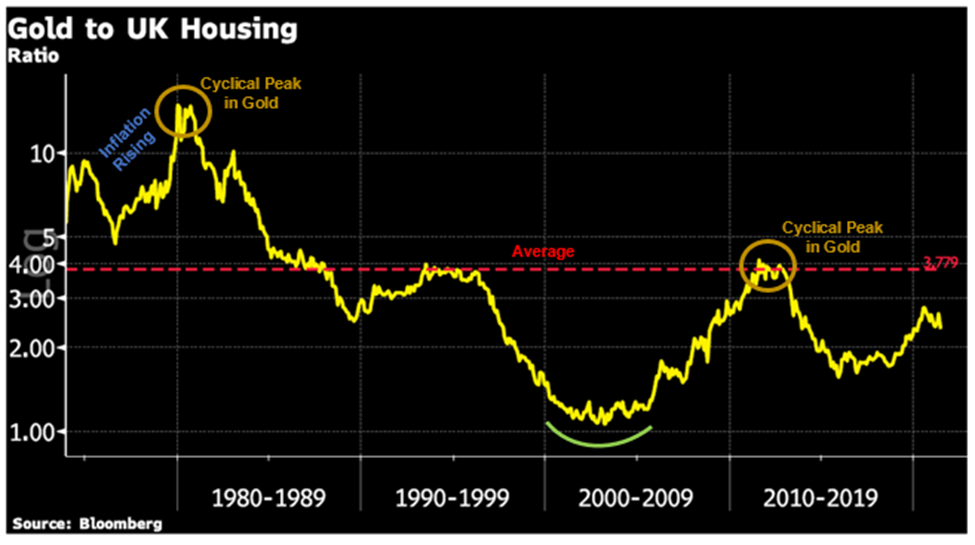
House prices have been a very effective store of value, the chart below shows the ratio of gold to a UK House Price Index. This relationship is surprisingly similar to the S&P 500 and MSCI world markets. However, the rise in house prices has been even more prominent since 1971.
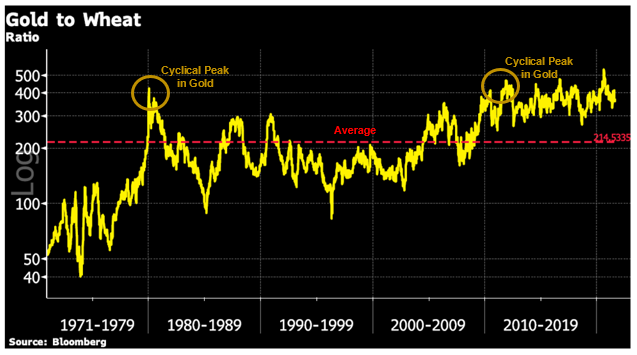
The gold to wheat price chart stretches all the way back to when it was government mandated at US$35 per ounce in 1971.
We can see that it spent the decade from 1971 to 1981 breaking free of its artificially low prices by climbing 6-fold against wheat.
Download Your Free Guide

In the most recent 40 years the gold to wheat price ratio has moved within a band roughly set by the 1981 high and the 1985 low.
We find this is interesting because stability between gold and wheat over long time periods makes sense. Wheat is not something crowds of people can invest in therefore only rarely does mania or panic influence the gold to wheat ratio.
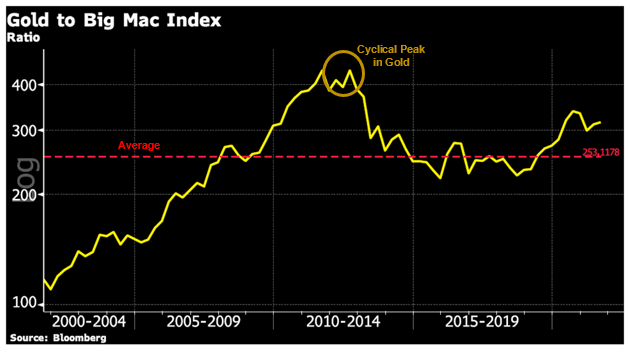
Big Macs are maybe the least financialized global benchmark item ever tracked by economists. There are no futures contracts. They are no ETFs nor YOLO options, not even a McCoin.
Big Mac delivery is only physical, singular and delicious! We want readers to note that the ratio of gold prices to Big Mac prices is roughly stable from 2005 onwards.
This makes sense because like wheat, hamburgers and gold prices should have a boring stable statistical relationship. In the 2000 until 2005 period this dataset shows the base affect of gold lifting off a generational low of US$250 per ounce.
Gold to oil is depicted in the final chart. From 1985 until today we can see neither item has had the upper hand for long, no trend exists. This makes total sense of a very long period because although both are important to the economy, each serves a valid economic purpose which the other cannot perform.
The closing sentence of the above paragraph is a clever tease for next week’s blog. Until then please ponder this question: if stocks and housing serve a valid economic purpose just like oil does, and none can perform the job of another via substitution. Then why have stocks and houses trended against gold, yet Big Macs, wheat, and oil have not?

Is Gold Still in a Bull Market?
Watch Gareth Soloway on GoldCore TV
From the Trading Desk
Stock Update:
British Gold Sovereigns, we still have a limited number available at spot plus 5.25%. Please call our trading desk to avail of this offer.
Gold Britannia’s 1oz Coins start at 6.5% over spot.
The Lowest premium on gold is on the 1oz bar at a very competitive 3.75% over spot.
Gold Krugerrand are currently the lowest premium on 1oz coins at spot plus 5.5%.
Silver coins are available for storage or delivery.
Silver coins are significantly cheaper when purchased for storage in Zurich as they can be purchased VAT Free. We have excellent availability at the moment.
Silver 100oz and 1000oz bars are also available VAT free in Zurich.
Please see below our extended trading hours.
** We have extended our opening hours. Phone lines, online ordering and webchat are now open until 09:00-22:00 (Europe/Dublin) USA 09:00 to 17:00 EST**
Market Update:
The Federal Reserve’s Federal Open Market Committee (FOMC) meeting commenced yesterday and will conclude on Thursday.
It will conclude with their most current monetary policy statement as well as a press conference with Fed Chairman Jerome Powell.
Many analysts believe that the meeting will be broadly neutral but will be watchful eye for a new covid wave.
What will be interesting to observe is how they word and view any upside inflation risks, Powell up until now has dismissed higher inflation as transitory.
Tappering will also be discussed but we are unlikely at this time to get any further details in terms of policy or timing.
Meanwhile current monthly asset purchases of $120 billion continue.
Many analysts believe that to continue to purchase mortgage-backed securities in an already extremely heated housing market is unneeded.
Gold is still in a tight trading range but this morning is trading above its 200 day moving average.
Silver sold of heavily on Tuesday but has bounced nicely this morning to $25.50 to erase those losses earlier in the week.
A quote that caught our attention this week from the late Richard Russel (Dow Theory Letters), ‘A bull market is a bull. It tries to throw off its riders.”
After all the frustrating price action of late, nothing has changed, we are still in a bull market and the trick is to stay on that bull!
Buy Gold Coins

GOLD PRICES (USD, GBP & EUR – AM/ PM LBMA Fix)
28-07-2021 1799.30 1796.60 1296.04 1297.15 1522.03 1524.24
27-07-2021 1797.15 1800.35 1302.75 1302.91 1525.06 1524.00
26-07-2021 1808.15 1800.20 1311.63 1302.80 1533.13 1524.77
23-07-2021 1803.05 1799.60 1313.34 1308.67 1532.77 1529.84
22-07-2021 1797.40 1799.45 1308.51 1307.12 1523.84 1523.05
21-07-2021 1805.90 1802.15 1324.81 1317.73 1533.75 1529.30
20-07-2021 1815.30 1823.05 1328.26 1339.21 1538.47 1549.77
19-07-2021 1803.25 1814.90 1314.03 1322.88 1531.32 1535.04
16-07-2021 1822.00 1824.30 1316.03 1321.89 1541.96 1545.73
15-07-2021 1832.00 1823.75 1323.80 1316.75 1546.21 1543.44
Buy gold coins and bars and store them in the safest vaults in Switzerland, London or Singapore with GoldCore.
Learn why Switzerland remains a safe-haven jurisdiction for owning precious metals. Access Our Most Popular Guide, the Essential Guide to Storing Gold in Switzerland here
Receive Our Award Winning Market Updates In Your Inbox – Sign Up Here